True to their word, the
University of Virginia admissions office released decisions promptly at 5:00 p.m. this afternoon. After initial complaints about clogged servers, reactions began pouring into student discussion boards including
College Confidential.
“My hard work paid off,” crowed one happy admit from Ohio.
But the news wasn’t universally good. “Don’t want to sound bitter,” remarked one disappointed applicant. “But I am kinda losing faith in the ‘holistic’ approach.’”
Without her usual commentary,
Dean J simply posted preliminary numbers for this year and recommended that admissions junkies with a real “need to know” could research numbers
as far back as 1977 on the webpage maintained by the
UVa Office of Institutional Assessment.
But the simple comparison with 2010 is interesting enough. Last year at this time, UVa received 22,516 applications and made offers to 6,907 students. Including those pulled from the wait list, the total number of offers for the Class of 2014 was 7,212.
For this year’s class, the total number of applications went up to 24,005, but the number of in-state applicants actually
decreased slightly from 7,964 in 2010 to 7,955. This means the additional applications came entirely from of out of state, perhaps the result of intensive recruitment efforts made by the admissions office.
To increase the size of the incoming class by 120 students, the admissions office made 7,750 offers, or 843 more than last year at this stage in the process. Of these offers, 3,562 went to Virginians and 4,183 went to out-of-state students. Overall, the
initial admission rate went up slightly from 31 percent in 2010 to 32 percent in 2011.
There was no discussion on Dean J’s blog of the size of this year’s wait list. Last year, a decision was made to decrease the size of the wait list to a more realistic number than in previous years. It is unclear if that remained the policy.
In any event, here are all the preliminary numbers released by the UVa admissions office:
Total number of applications: 24,005 (up from 22,512 last year)
Total number of VA applications: 7,955 (down from 7,964 last year)
Total number of out-of-state applications: 16,045 (up from 14,652)
Overall offers: 7,750 (6,907 this time last year—7,212 including wait list offers)
Total VA offers: 3,562 or 45% of resident applications (3,380/42% last year)
Total out-of-state offers: 4,183 or 26% of nonresident applications (3,527/24% last year)
The offers for residents and nonresidents are similar because historic yield—or percent of students accepting offers—for nonresidents is generally lower.
Dean J reports that the middle 50% SAT scores among admitted students ranged from 1950-2210. And just over 94 percent of the students receiving offers of admission were in the top 10 percent of their class.
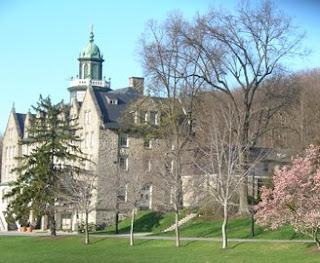
Image courtesy of Wikipedia.


